Case Study: Modelling Engagement Metrics for a Public Installation in South Flats
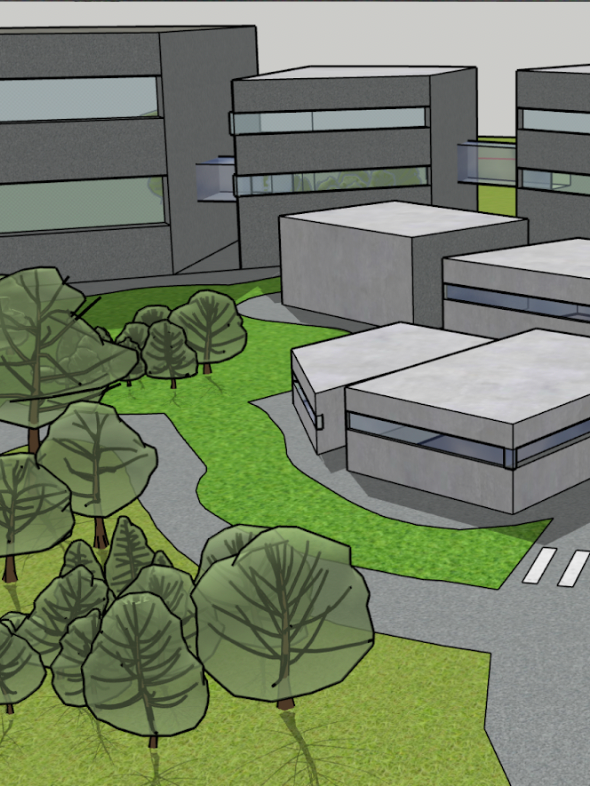
As a Product Design Research Consultant working with Low Tide Properties, I supported the development of a motion-responsive public art installation designed to increase engagement in South Flats, an emerging creative district in Vancouver. My role involved creating a proof-of-concept data model and dashboard using Power BI to simulate how real-time interaction with the sculpture could be measured and monitored once installed.
While the physical installation was still in the pre-build phase, I developed a forward-looking system that included simulated foot traffic data, motion sensor triggers, and dwell time estimates. This model demonstrated how insights could be captured, visualized, and even automated, helping internal stakeholders at Low Tide understand the potential for data-driven decision-making around public space activation. The dashboard played a key role in supporting project approval and illustrating how future digital infrastructure could scale across the neighbourhood.
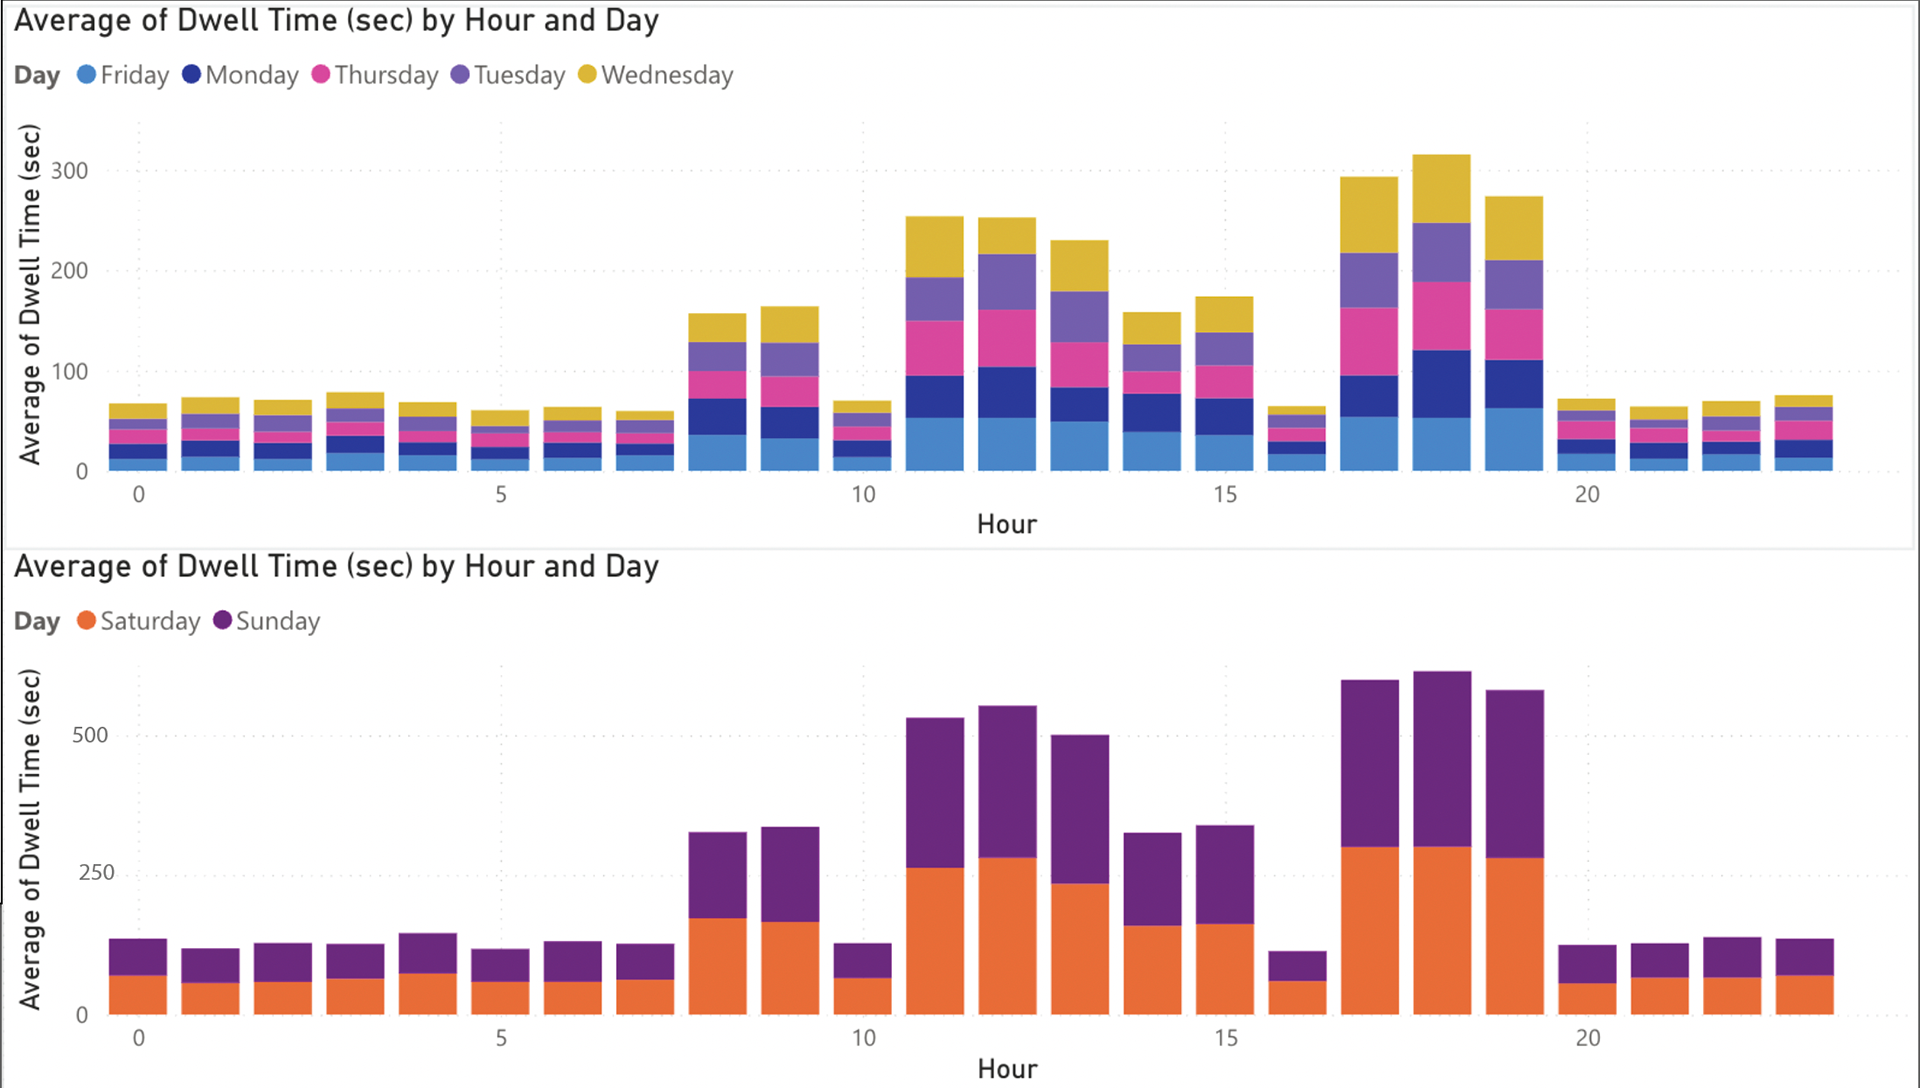
This visualization compares average dwell time across weekdays (top) and weekends (bottom), highlighting distinct engagement rhythms in South Flats. Three consistent peaks emerge across both segments: late morning (11AM), early afternoon (2PM), and early evening (6PM) — suggesting strong alignment with coffee breaks, lunch hours, and post-work exploration.
Notably, weekend engagement is significantly higher and more sustained throughout the day, with dwell time nearly doubling during peak periods. This supports the installation’s design objective of increasing linger time, particularly during leisure hours. For stakeholders, this chart demonstrates the sculpture’s potential to anchor foot traffic during high-visibility weekend windows while still activating the space during daily commute cycles.
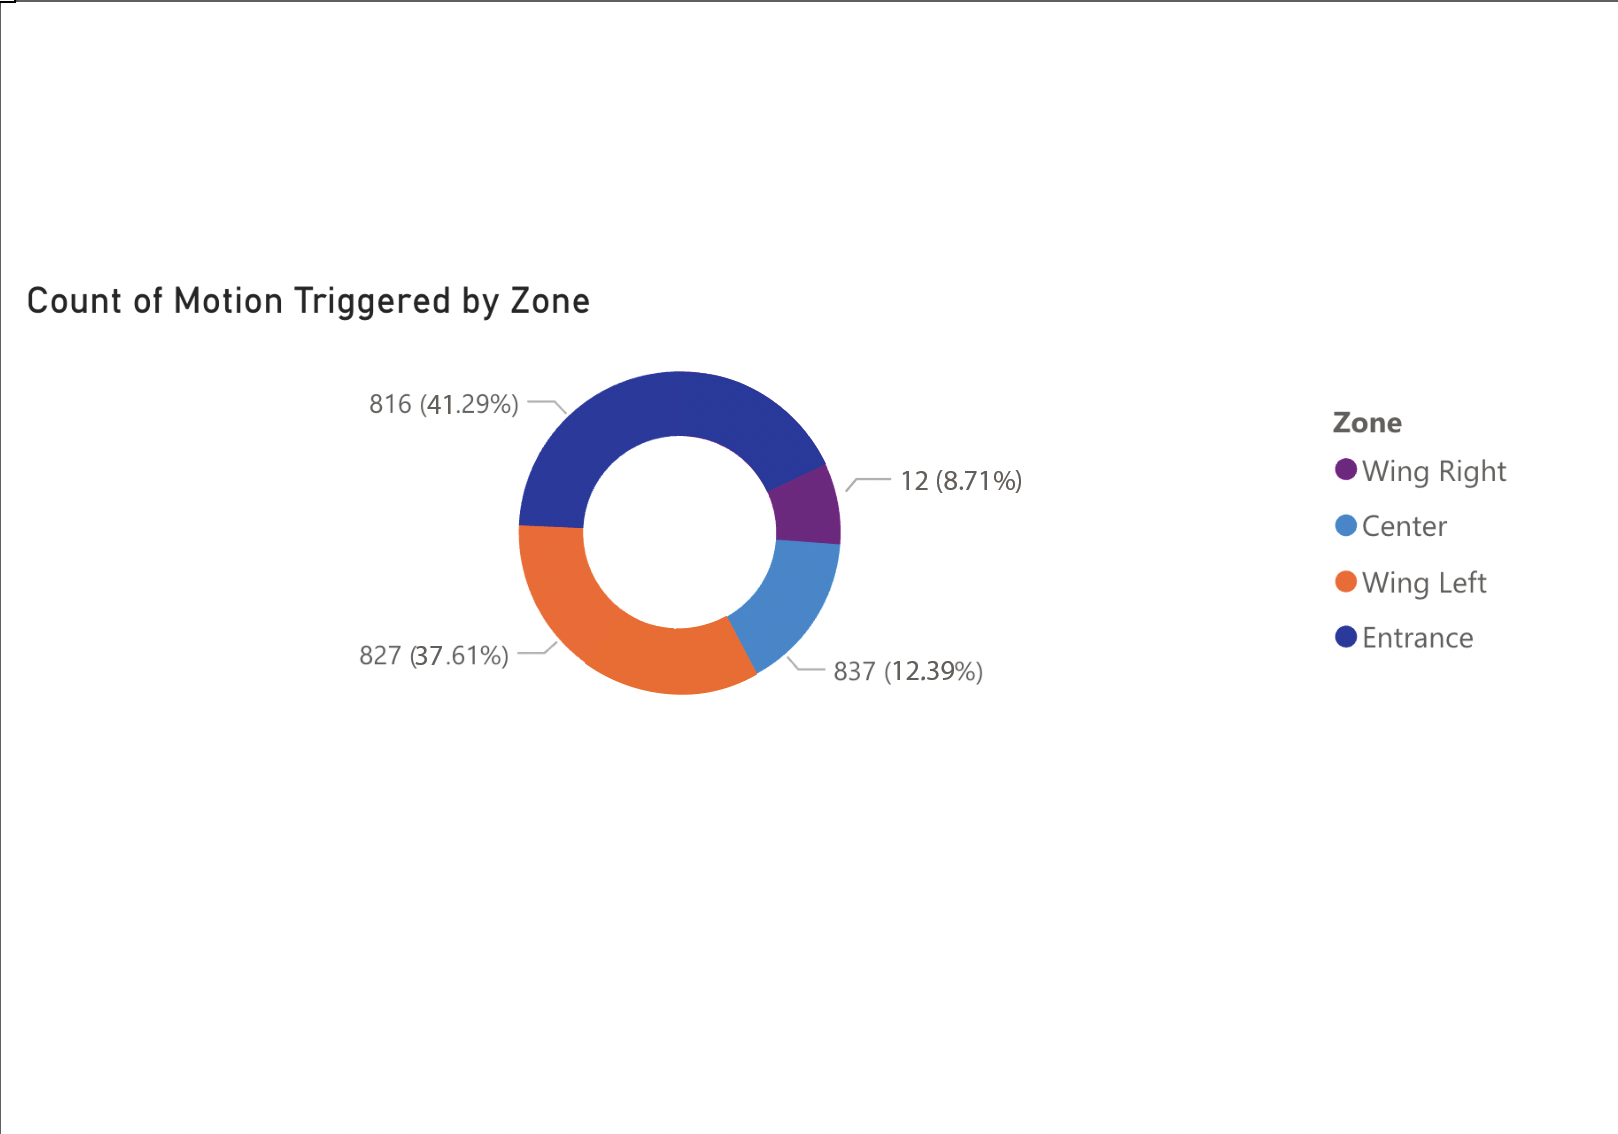
This donut chart visualizes where motion-triggered interactions occurred most frequently within the sculpture. The results highlight clear spatial patterns: the Entrance and Wing Left zones collectively account for nearly 80% of total activity, while Wing Right and Center see significantly less engagement.
These insights are critical for both design refinement and future sensor placement. For example, higher interaction at the entrance suggests that the sculpture successfully catches attention early, while lower interaction at the center may indicate an opportunity to enhance visual or auditory stimulus deeper within the installation.
By modelling these dynamics in advance, we demonstrated how the sculpture could not only respond to users but also adapt over time based on real-world behaviour.
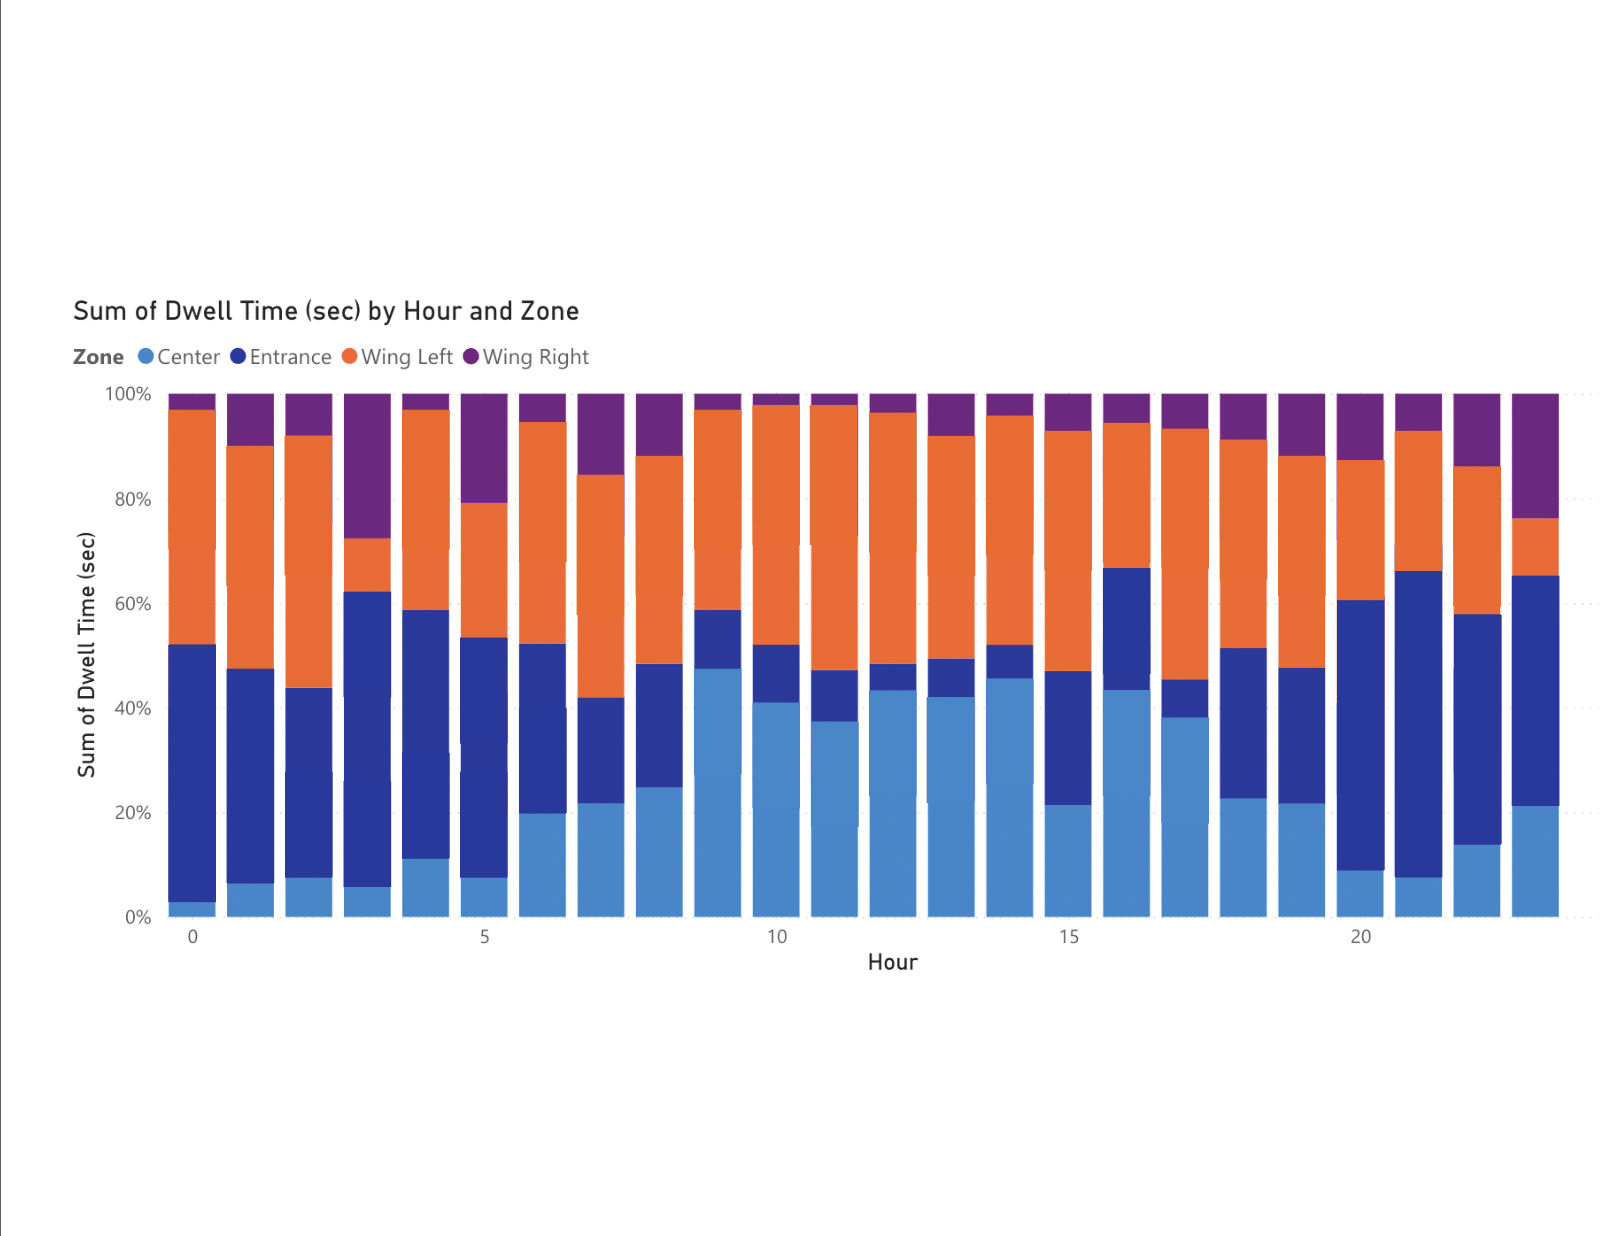
This normalized stacked bar chart shows how dwell time is distributed across the four sensor zones throughout the day. A few patterns emerge:
The Entrance and Wing Left dominate early and late hours, suggesting users are more likely to pause at the threshold or edge of the sculpture when foot traffic is lighter.
The Center zone sees its highest share of engagement during midday hours (10AM–2PM), indicating users are more willing to explore deeper into the sculpture during peak times.
Wing Right remains relatively underused, which may signal a need for enhanced attraction or improved visual accessibility from that side.
This chart is especially valuable for understanding how users move through the space dynamically across the day, helping inform future spatial adjustments or content targeting by zone.
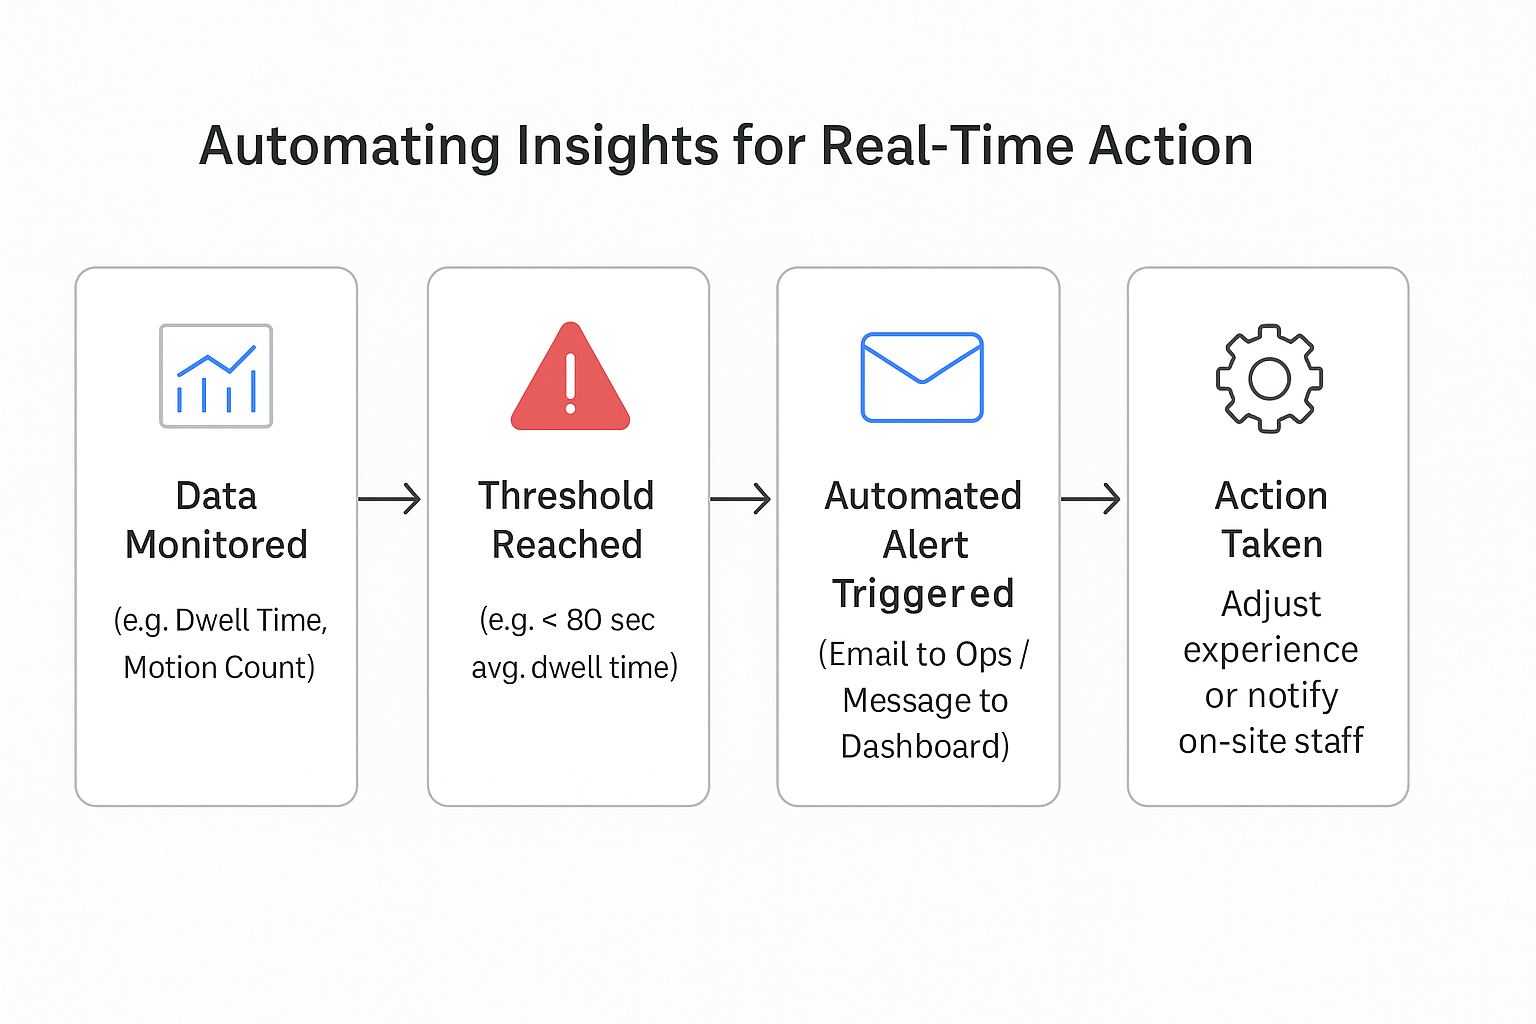
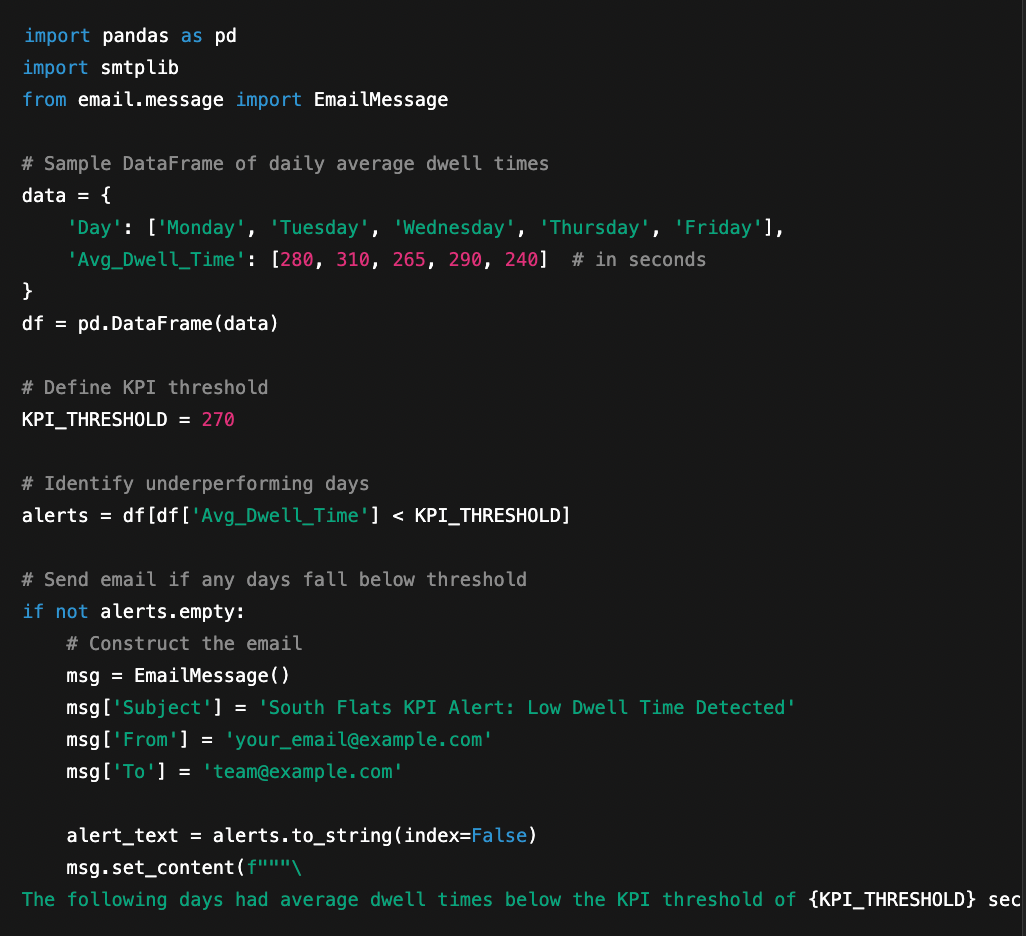
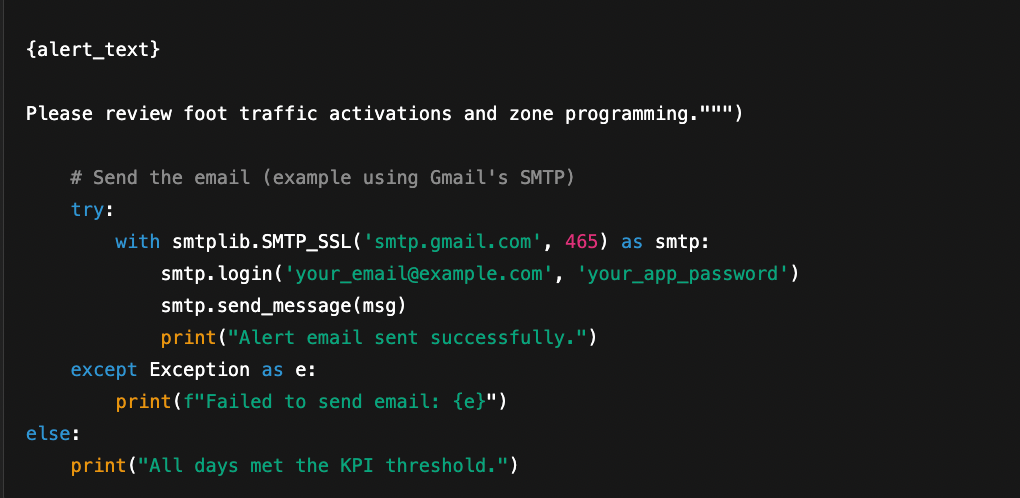
To demonstrate how data from the sculpture could drive real-time responses, I created a prototype automation system that tracks key performance indicators (KPIs) such as average dwell time. When predefined thresholds are met or missed, the system can trigger automated actions, such as sending an alert email to project stakeholders. The accompanying flowchart outlines this pipeline, from data monitoring to notification. I also developed a lightweight Python script as a proof of concept, showing how interaction data can directly inform timely, actionable decisions to support public space management.